Unified data engineering, lakehouse, warehousing, parquet storage, data pipelines, notebooks, Power BI dashboards, semantic models, and analytics solutions with Microsoft Fabric and Azure Synapse.
Fabric and Synapse provide the data side of the modern analytics architecture. They connect source systems, data lakes, parquet files, notebooks, SQL analytics, warehouses, semantic models, Power BI dashboards, and ML outputs into one governed analytics platform.
The screenshots below are Azure/Fabric/Synapse-style visuals packaged locally with this page so they render reliably. They show lakehouse data, parquet files, data pipelines, Power Query/Dataflows, notebooks, warehouse SQL, Power BI dashboards, Synapse workspace, and full architecture.
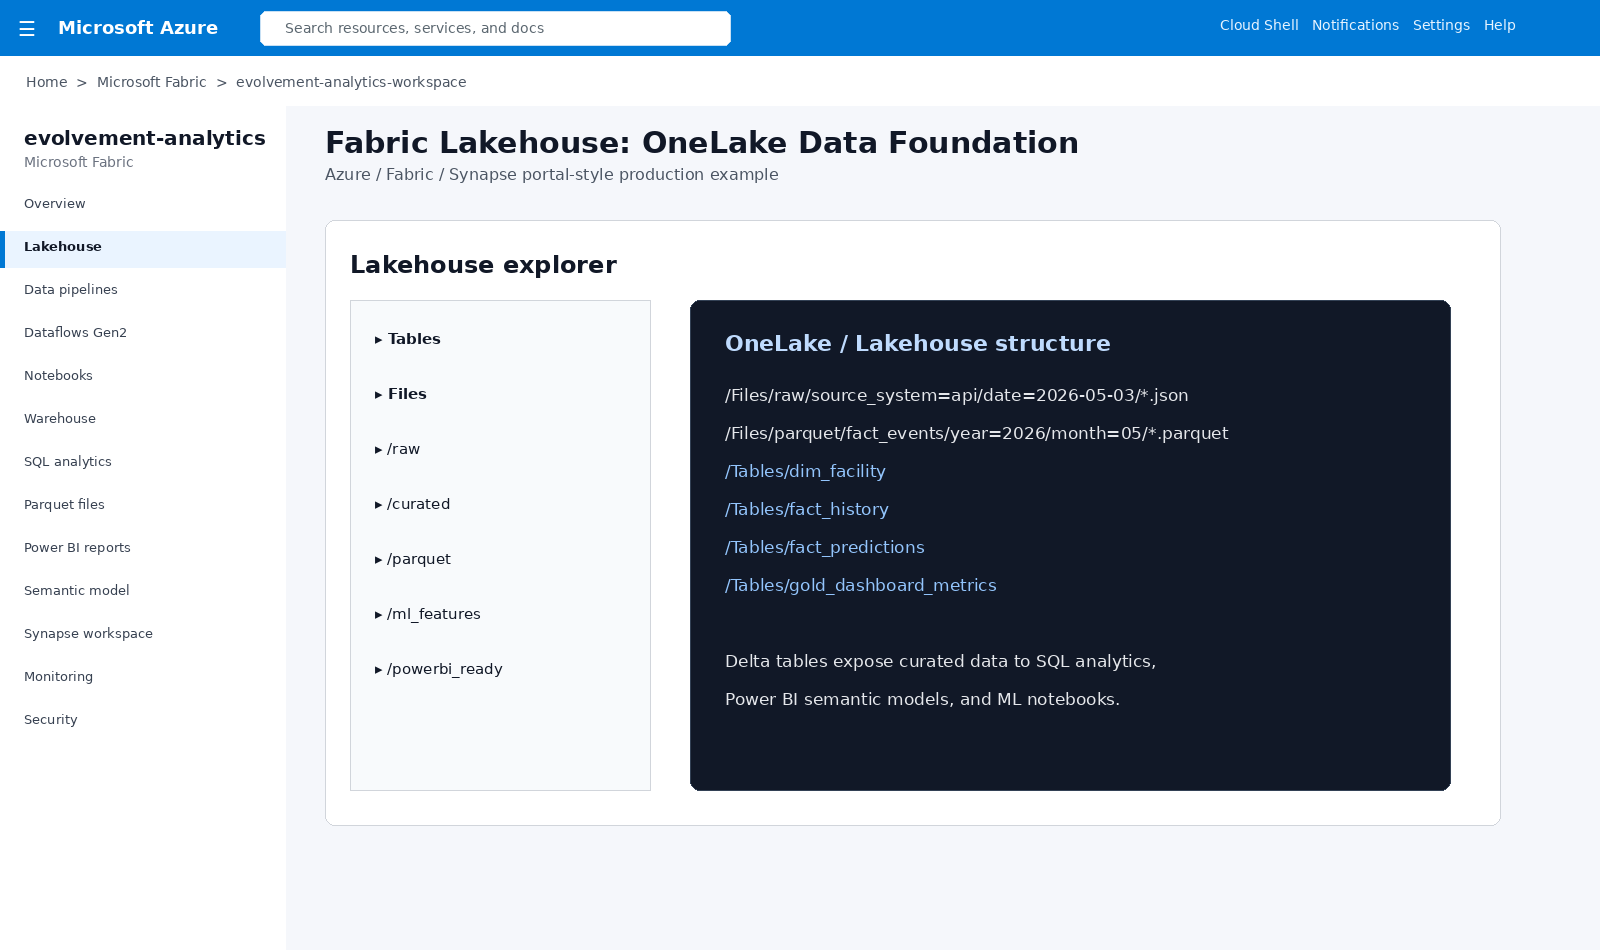
Lakehouse structure for raw files, parquet folders, Delta tables, ML features, and Power BI-ready curated data.
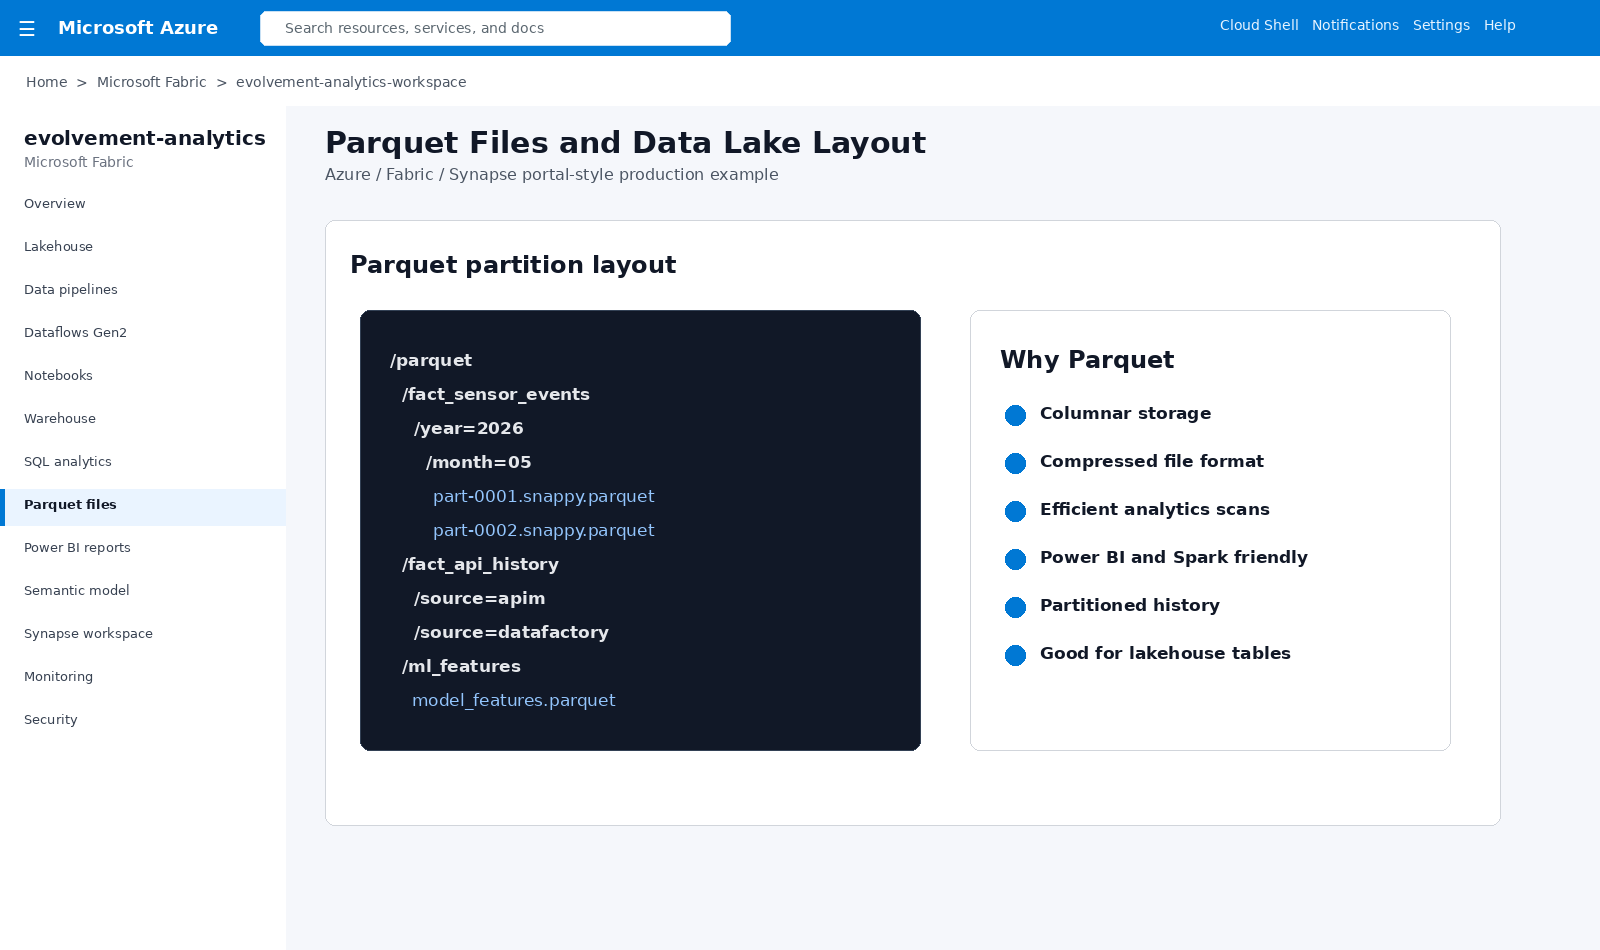
Partitioned parquet files support efficient analytics scans, large historical datasets, and lakehouse reporting patterns.
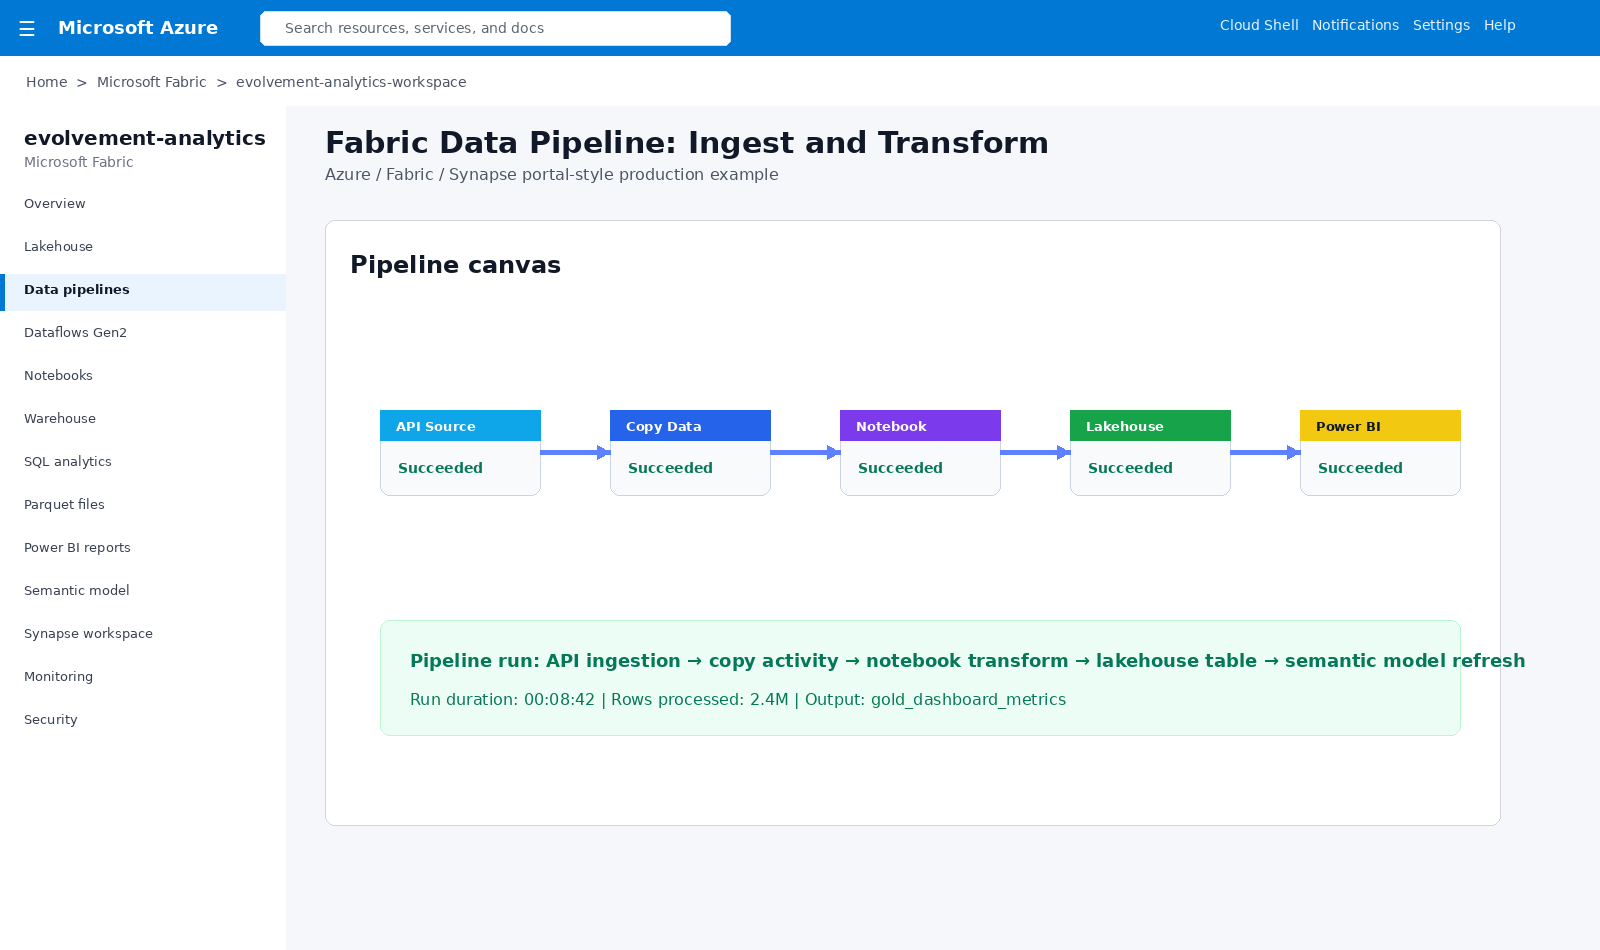
Pipeline orchestration moves source data through copy, notebook, lakehouse, and Power BI refresh steps.
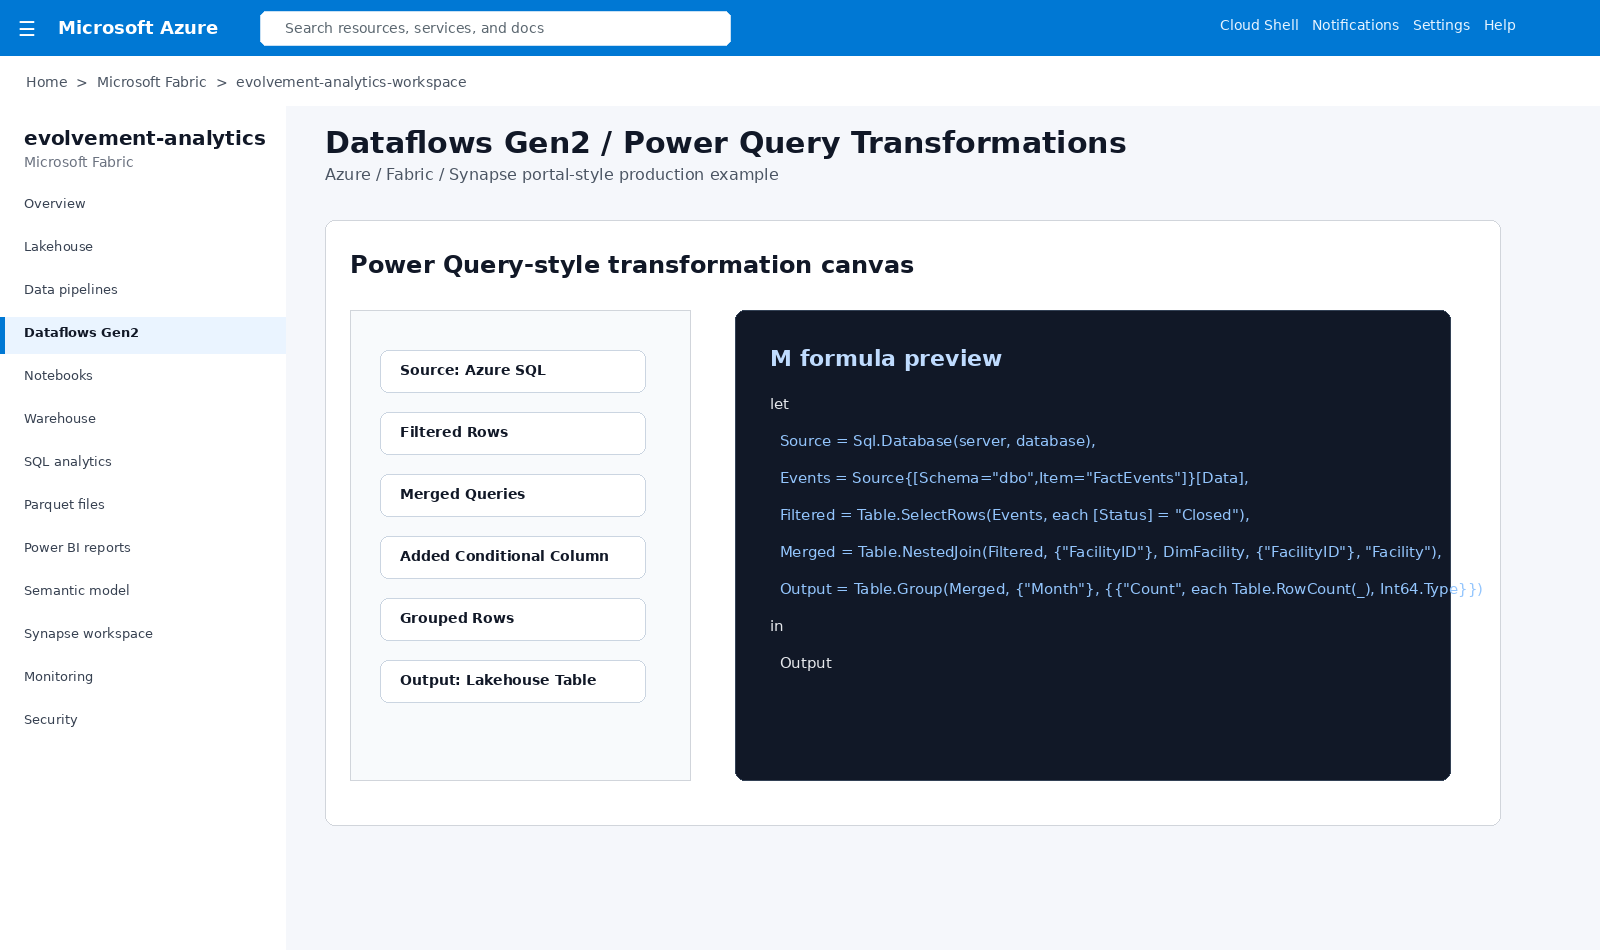
Power Query-style transformations filter, merge, group, enrich, and output curated lakehouse data.
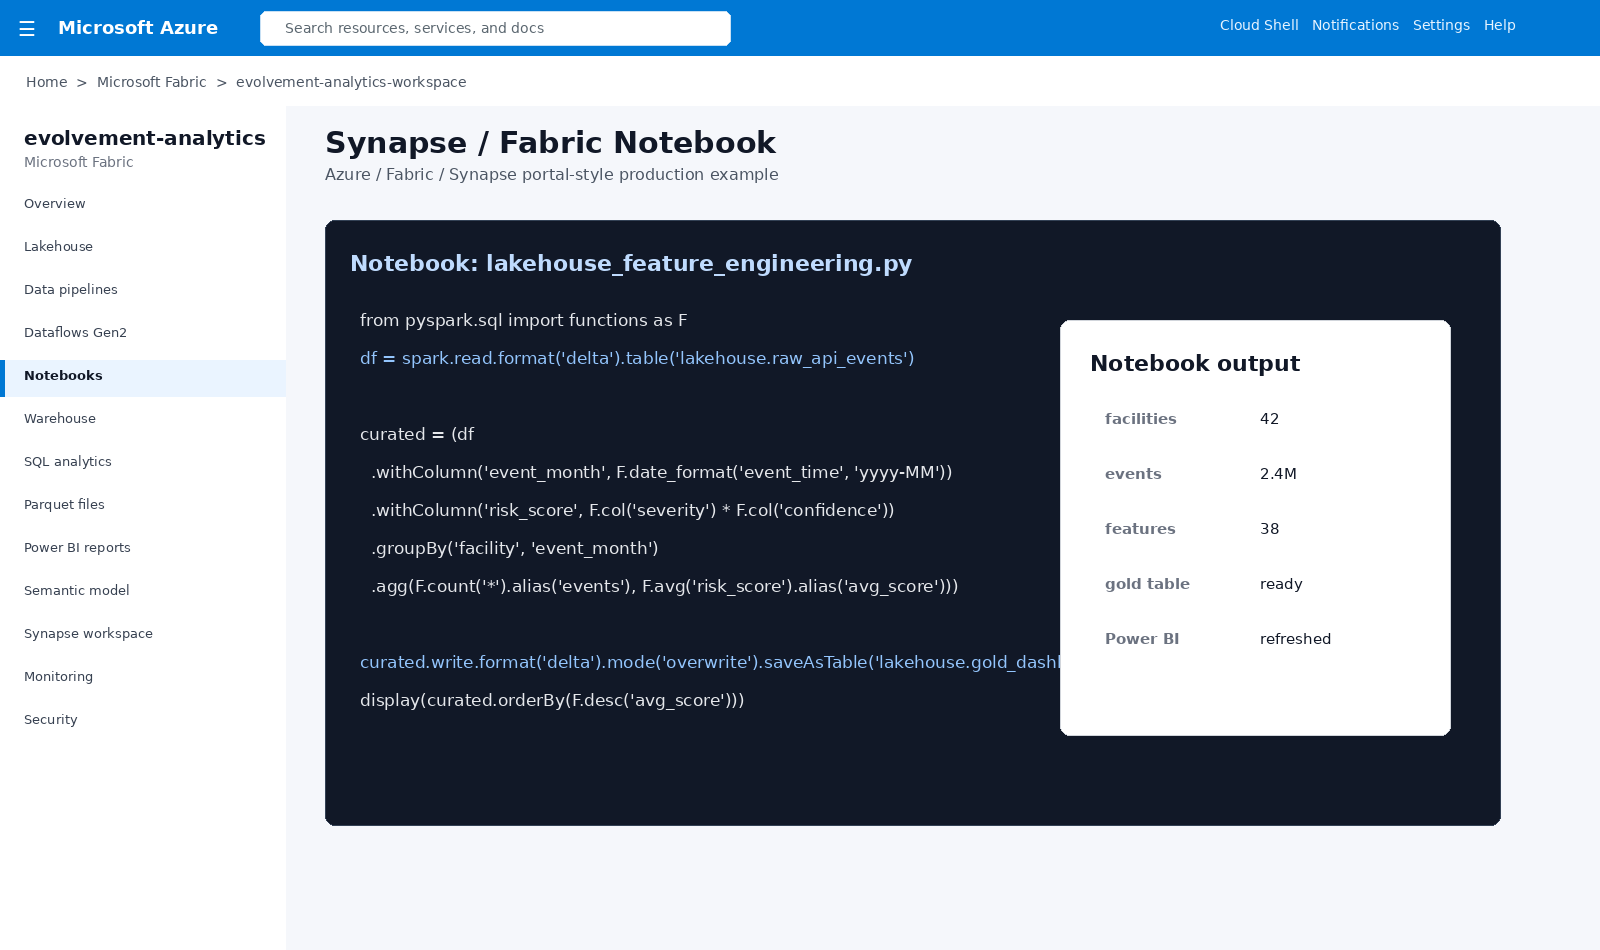
PySpark notebooks process lakehouse tables, engineer features, and publish gold dashboard metrics.
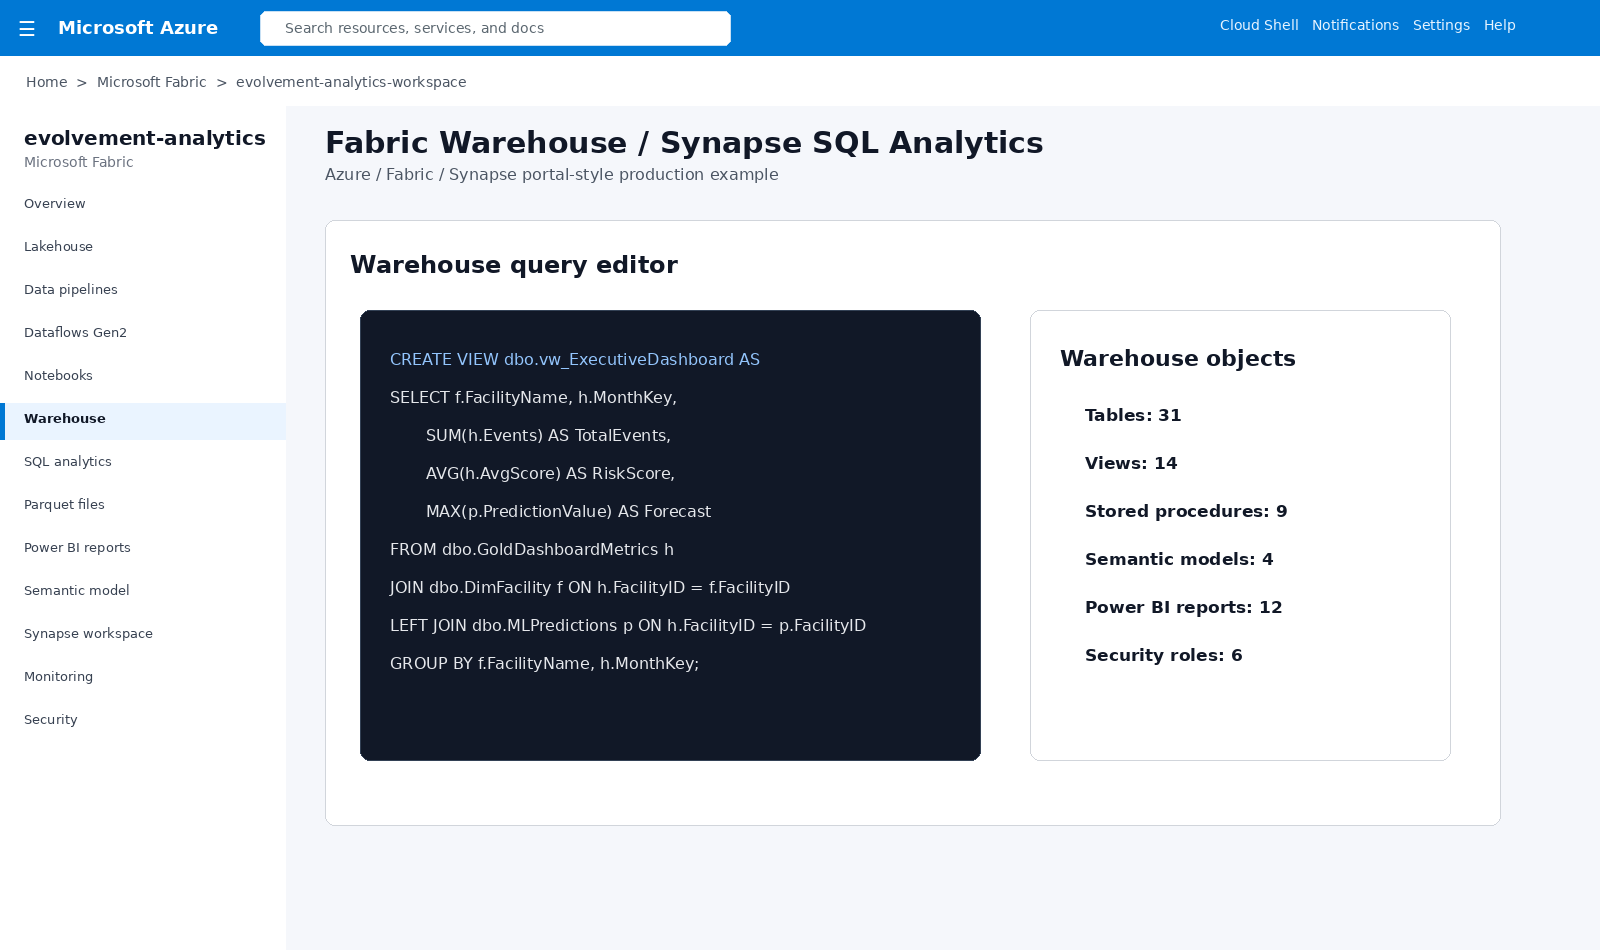
Warehouse query editor supports views, reporting facts, predictions, and Power BI semantic model outputs.
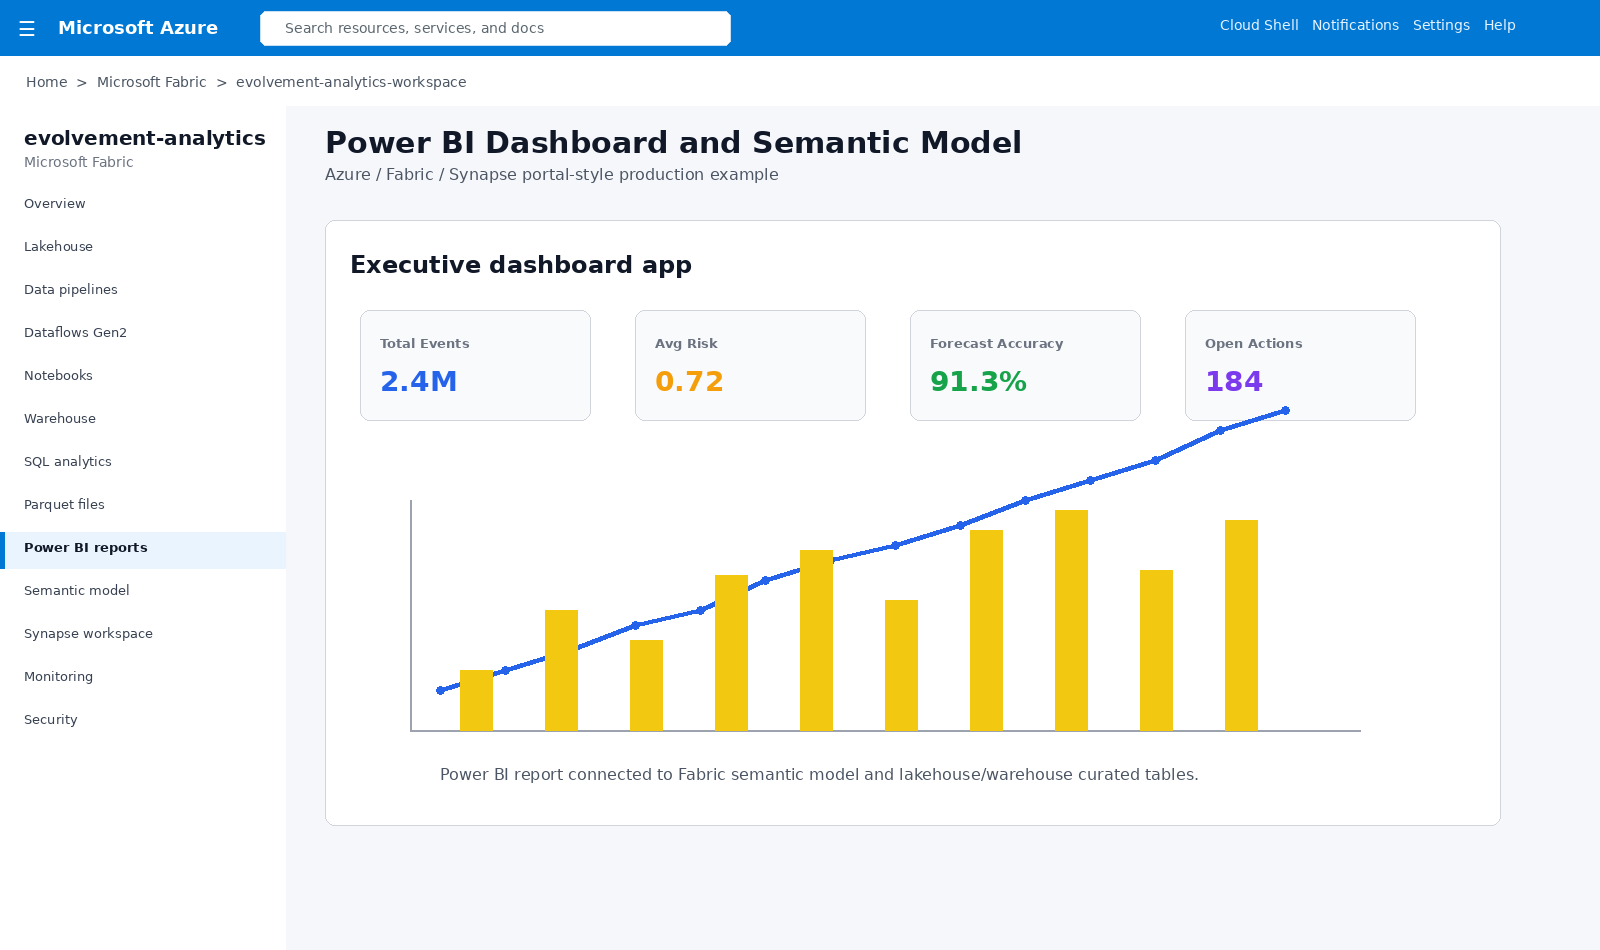
Executive dashboards visualize KPIs, historical trends, forecast accuracy, risk, and operational outcomes.
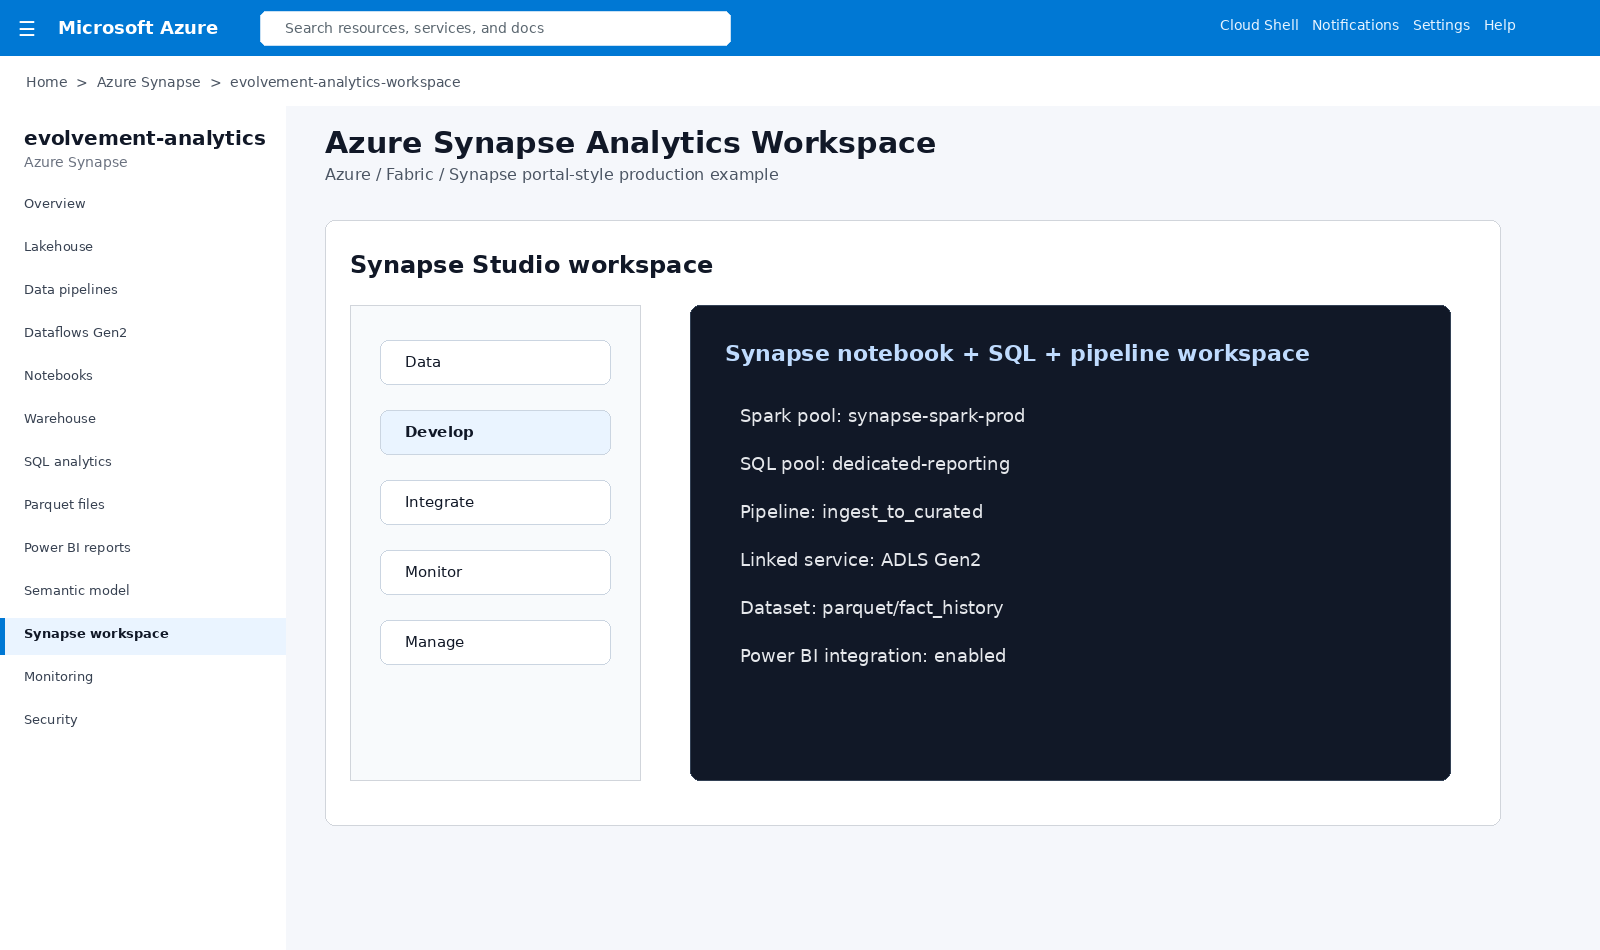
Synapse workspace brings together data, notebooks, pipelines, SQL pools, Spark pools, and Power BI integration.
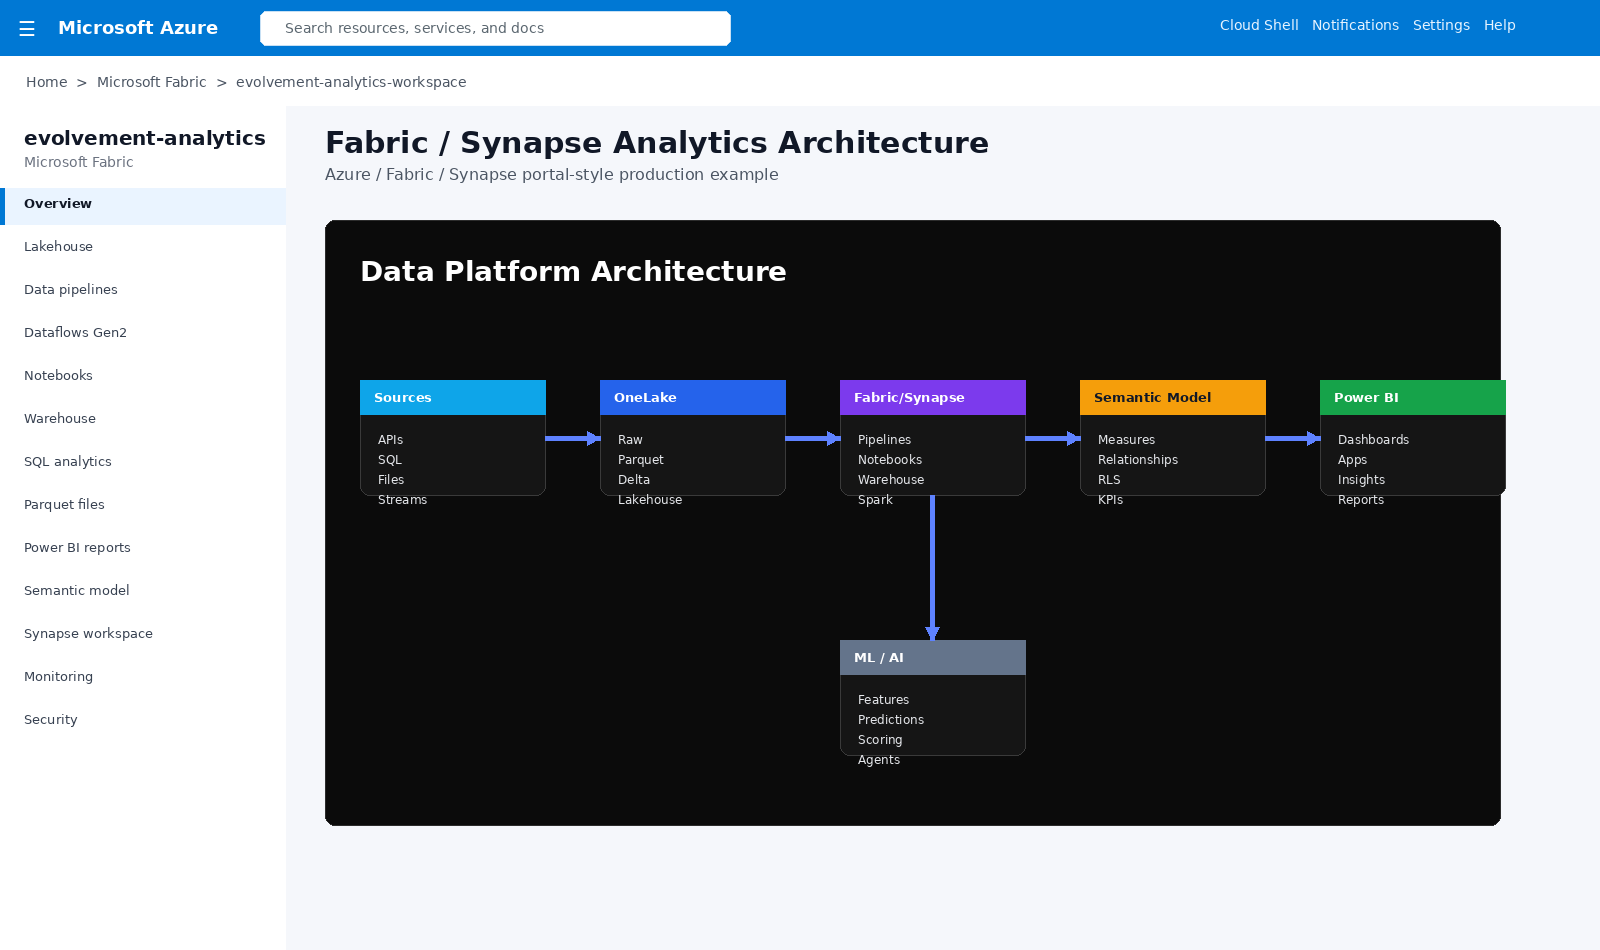
Sources, OneLake, Fabric/Synapse, semantic models, Power BI, ML, and AI outputs connected into one platform.
APIs, Azure SQL, files, streams, Cosmos, operational systems, and historical datasets.
Raw files, parquet, Delta tables, lakehouse folders, and curated data zones.
Pipelines, Dataflows, notebooks, Spark, SQL analytics, and warehouses.
Relationships, measures, RLS, KPIs, curated facts, and reporting dimensions.
Dashboards, apps, visualizations, drill-through pages, reports, and insights.
This pattern gives organizations an end-to-end data platform where source data lands in the lakehouse, parquet and Delta tables preserve efficient history, Fabric and Synapse transform and model the data, and Power BI turns curated outputs into interactive dashboards and decision-ready insight.