Evolvement LLC logo

IoT Sensors

Connected sensor design, installation, telemetry ingestion, AI vision, geospatial tracking, threshold automations, dashboards, and operational awareness solutions for real-time visibility.

What We Build

  • End-to-end IoT sensor solutions: buy, shape, design, fit the facade, install, collect data, automate thresholds, and deliver dashboards.
  • Azure IoT Hub ingestion for telemetry, actual counts, AI vision events, colors, triggers, schedules, size, shape, latitude/longitude, height, frequency, bandwidth, and spectrum data.
  • Sensor catalogs for water levels, environmental data, mechanical movement, frequencies, bandwidth, spectrums, AI vision, action triggers, height, location, and custom-fit sensors.
  • Threshold automations using time, schedules, measurement values, anomaly detection, size, shape, count, color, location, and operational events.
  • Dashboards using Power BI, Azure Maps, SQL, Cosmos, Stream Analytics, Logic Apps, and alerts.

Example Use Cases

  • Water-level sensors that alert when levels exceed thresholds and trigger work orders.
  • AI vision cameras that count objects, detect colors, classify shape, estimate size, and flag events.
  • Frequency and spectrum sensors that detect signal anomalies, bandwidth issues, or interference.
  • Geospatial dashboards showing sensor health, telemetry, alerts, latitude/longitude, and action status.
  • Automations that notify teams, update SQL, trigger Logic Apps, refresh dashboards, or request approval.

IoT Sensor Delivery Approach

IoT projects include the physical sensor layer and the data platform layer. Evolvement LLC can help identify the right sensors, shape or fit the device to the environment, install collection points, connect telemetry to Azure, define thresholds, create automations, and provide dashboards for operational decision-making.

  • Physical Design: buy, shape, design, fit facade requirements, mount, install, and maintain sensors.
  • Telemetry: collect readings such as water levels, counts, color, size, shape, frequency, bandwidth, spectrum, height, action states, and location.
  • AI Vision: detect objects, count items, identify colors, evaluate shape, measure size, and trigger events.
  • Geospatial: track latitude/longitude, sensor location, site status, movement, and mapped alert zones.
  • Automation: trigger workflows when thresholds, schedules, timing windows, or anomaly rules are met.

Azure IoT Examples

The screenshots below are packaged locally with this page so they render reliably. They show IoT Hub, telemetry streams, sensor catalog design, AI vision, threshold automations, Azure Maps dashboards, and architecture.
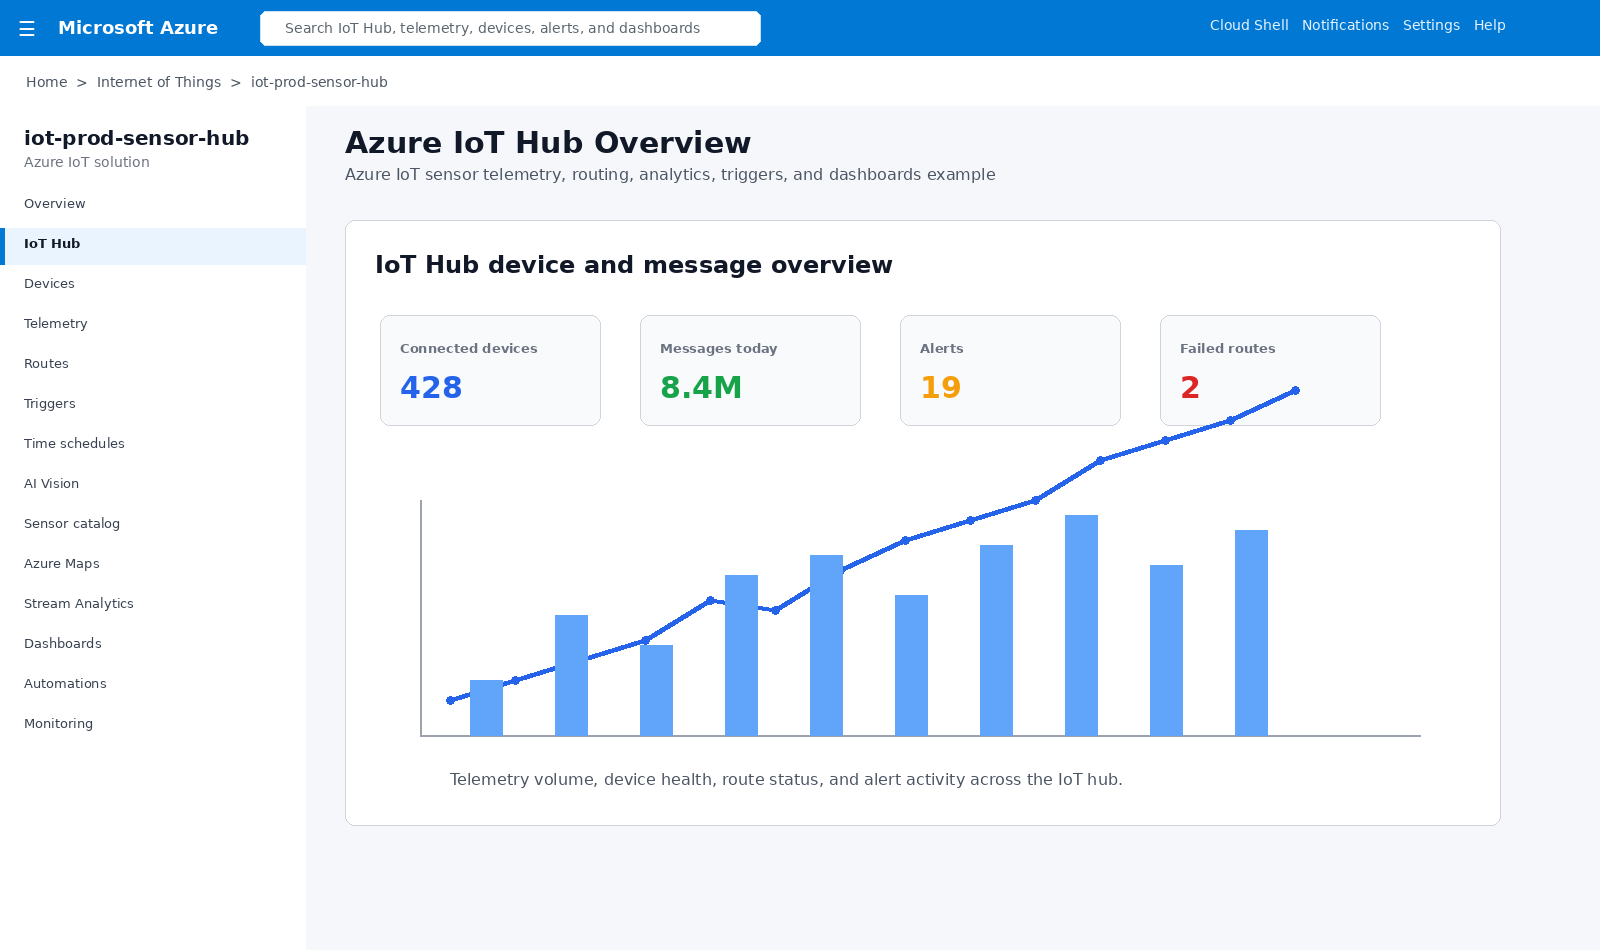
Azure IoT Hub overview

Azure IoT Hub Overview

Connected devices, message volume, alerts, route status, telemetry trends, and device health.
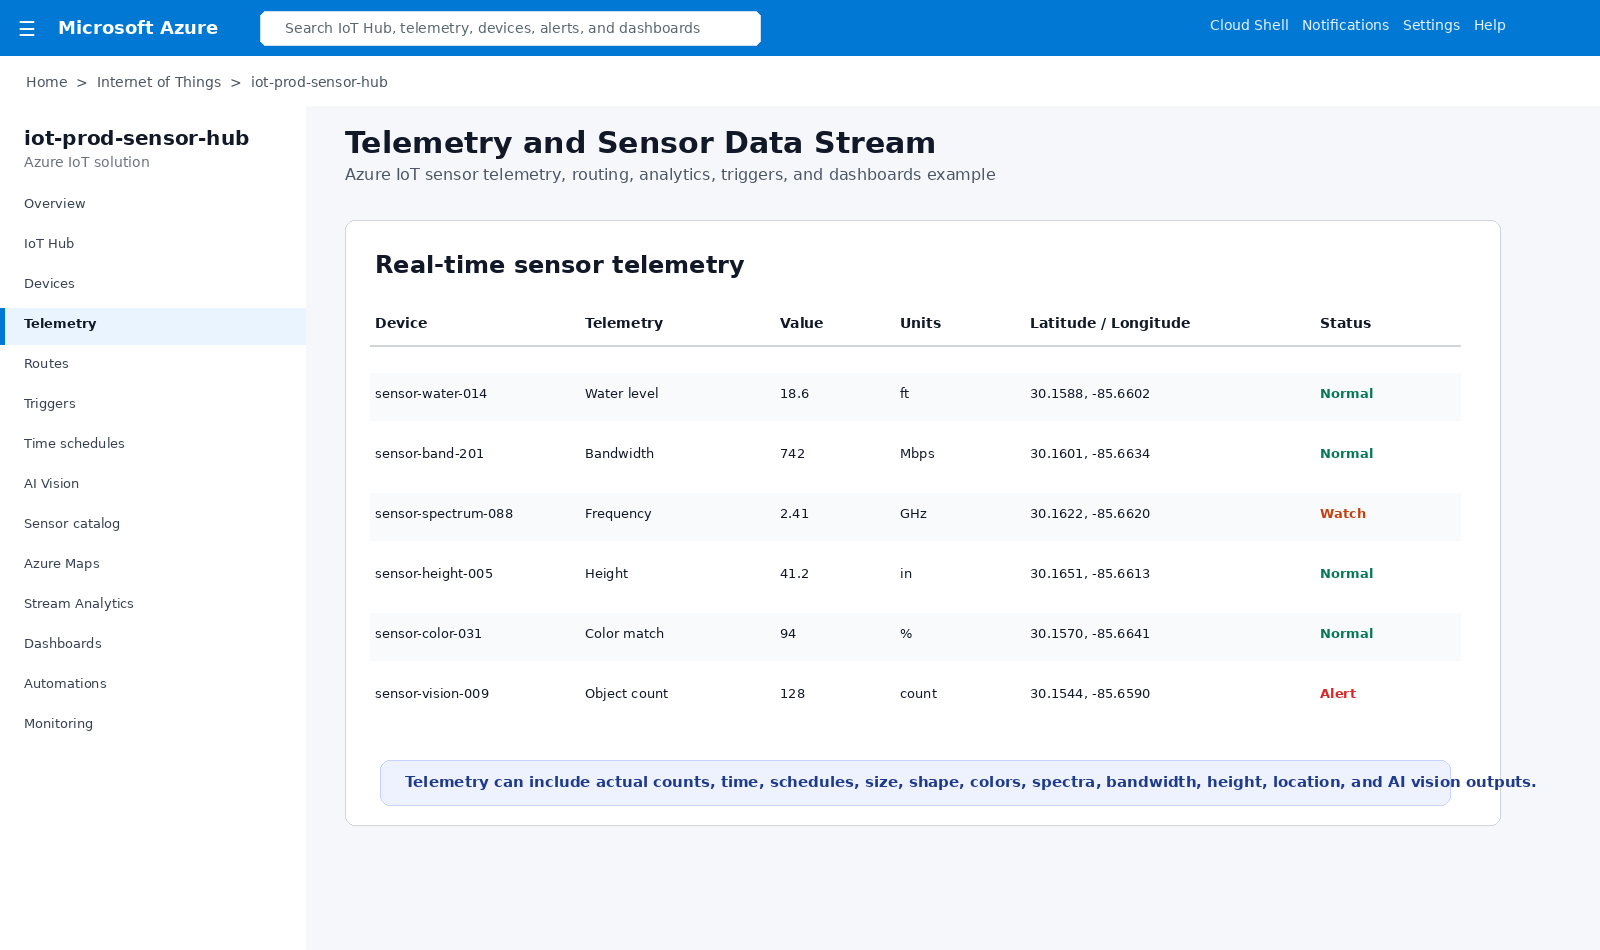
IoT telemetry stream

Telemetry and Sensor Data

Telemetry includes water levels, counts, frequency, bandwidth, color, size, shape, height, latitude/longitude, and AI vision outputs.
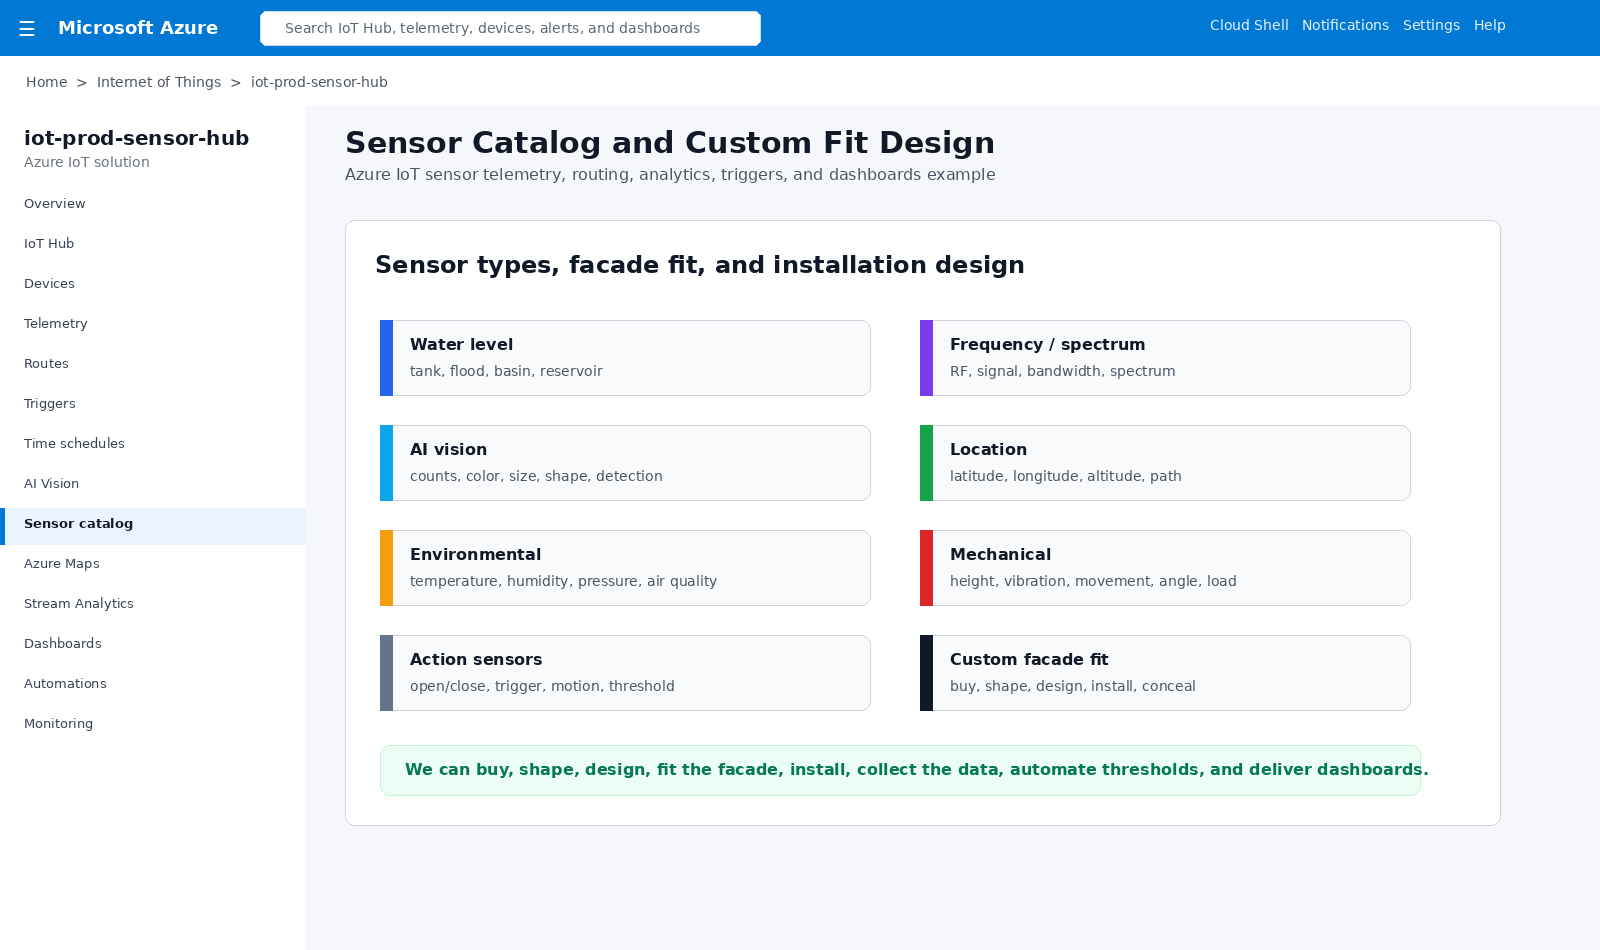
IoT sensor catalog design

Sensor Catalog and Custom Design

Sensor solutions can be purchased, shaped, designed, fit to the facade, installed, monitored, and integrated into dashboards.
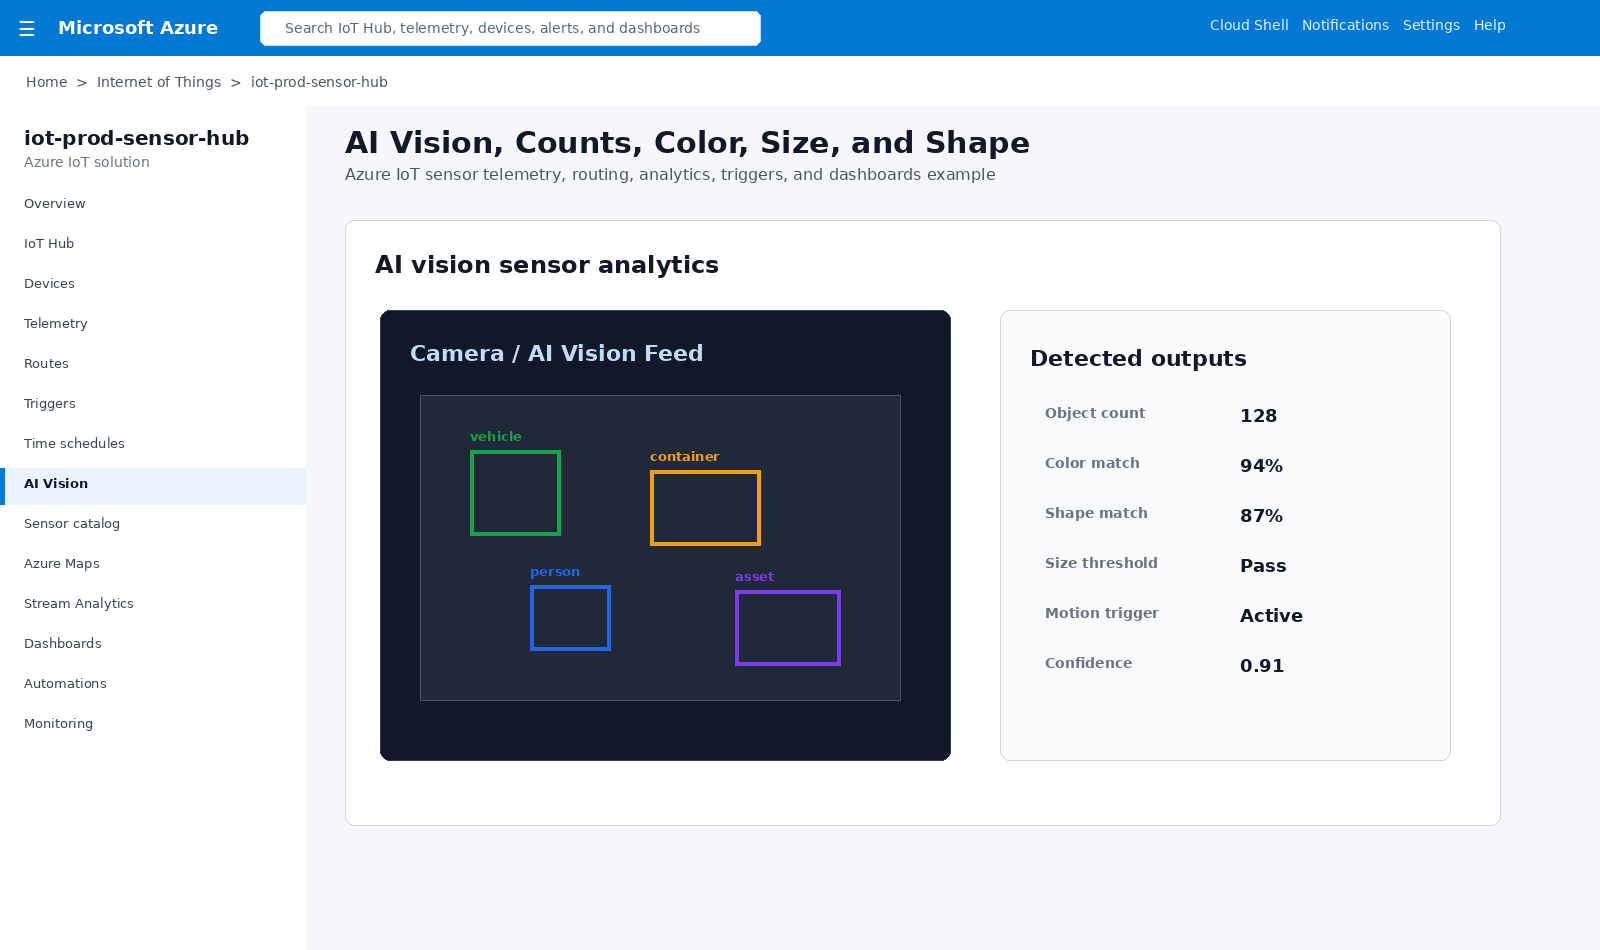
IoT AI vision analytics

AI Vision Analytics

AI vision sensors can count objects, detect color, identify shape, measure size, classify activity, and trigger action.
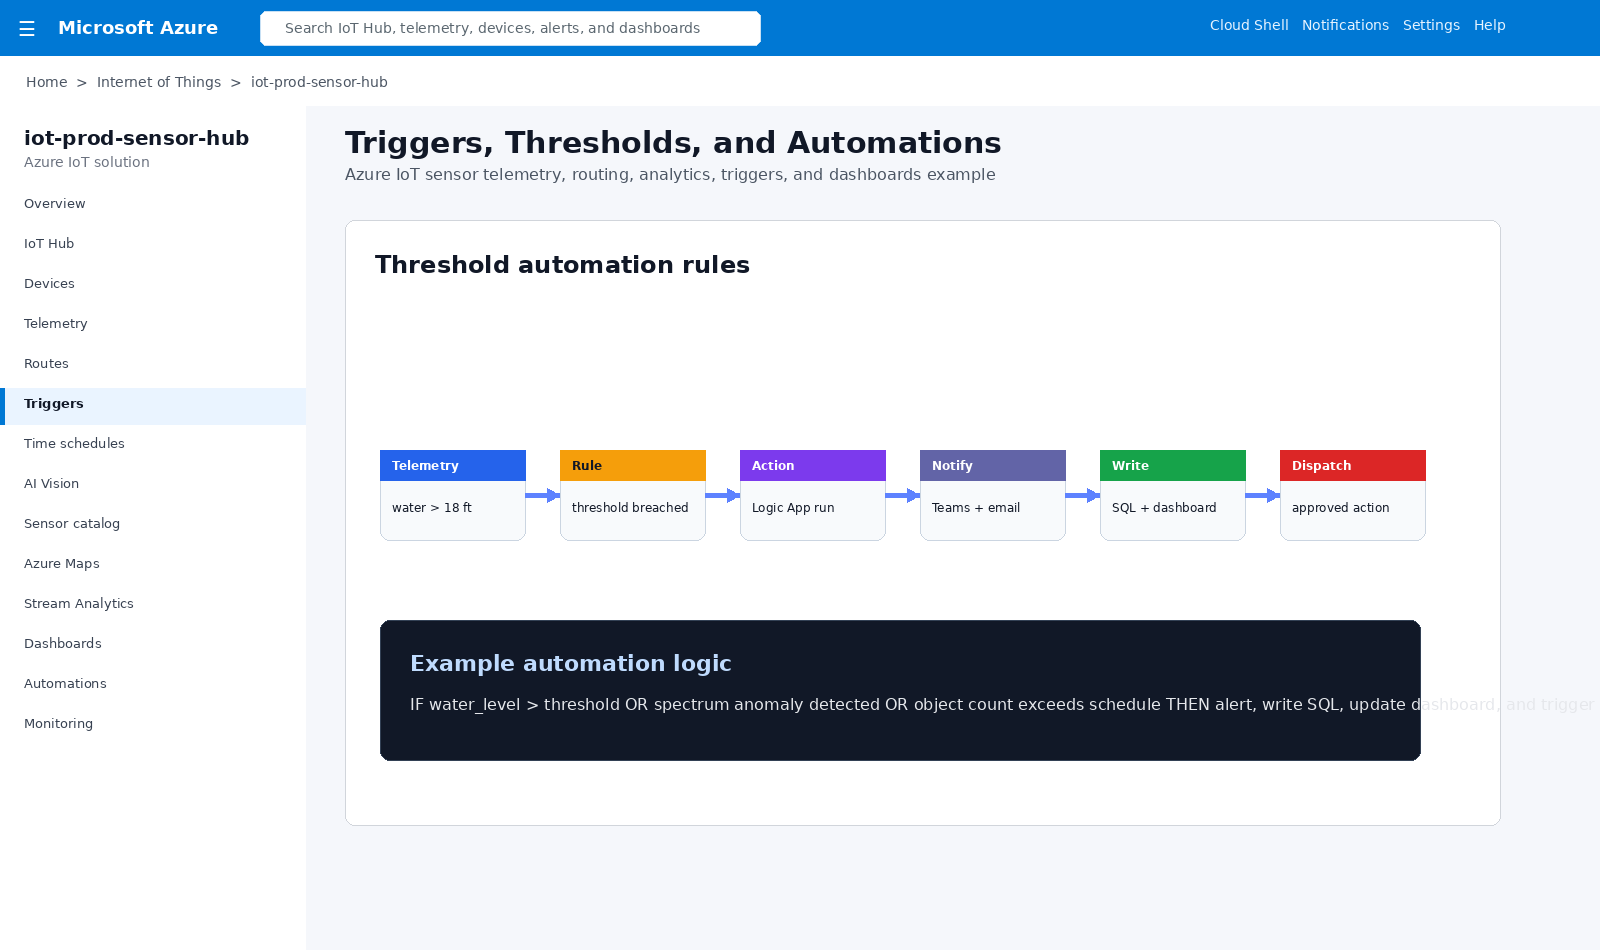
IoT threshold triggers automations

Threshold Triggers and Automations

Time, schedules, telemetry thresholds, anomaly detection, and AI events can trigger Logic Apps, Teams, SQL, and dashboards.
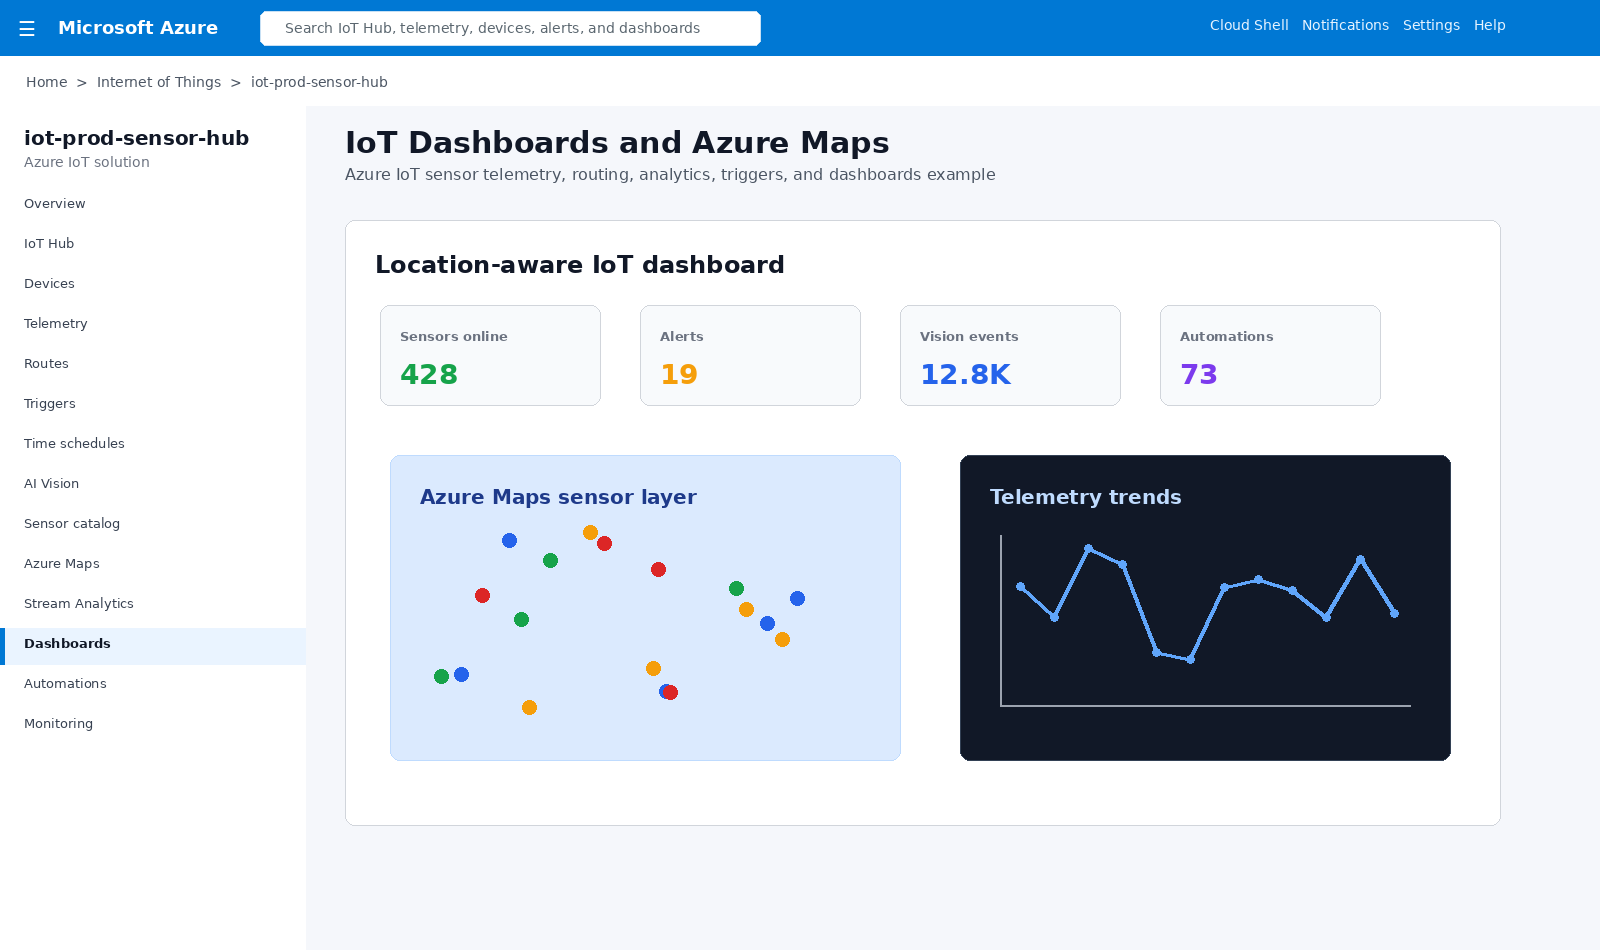
IoT Azure Maps dashboard

Azure Maps and Dashboards

Location-aware dashboards show sensor status, alerts, telemetry trends, and geospatial operational awareness.
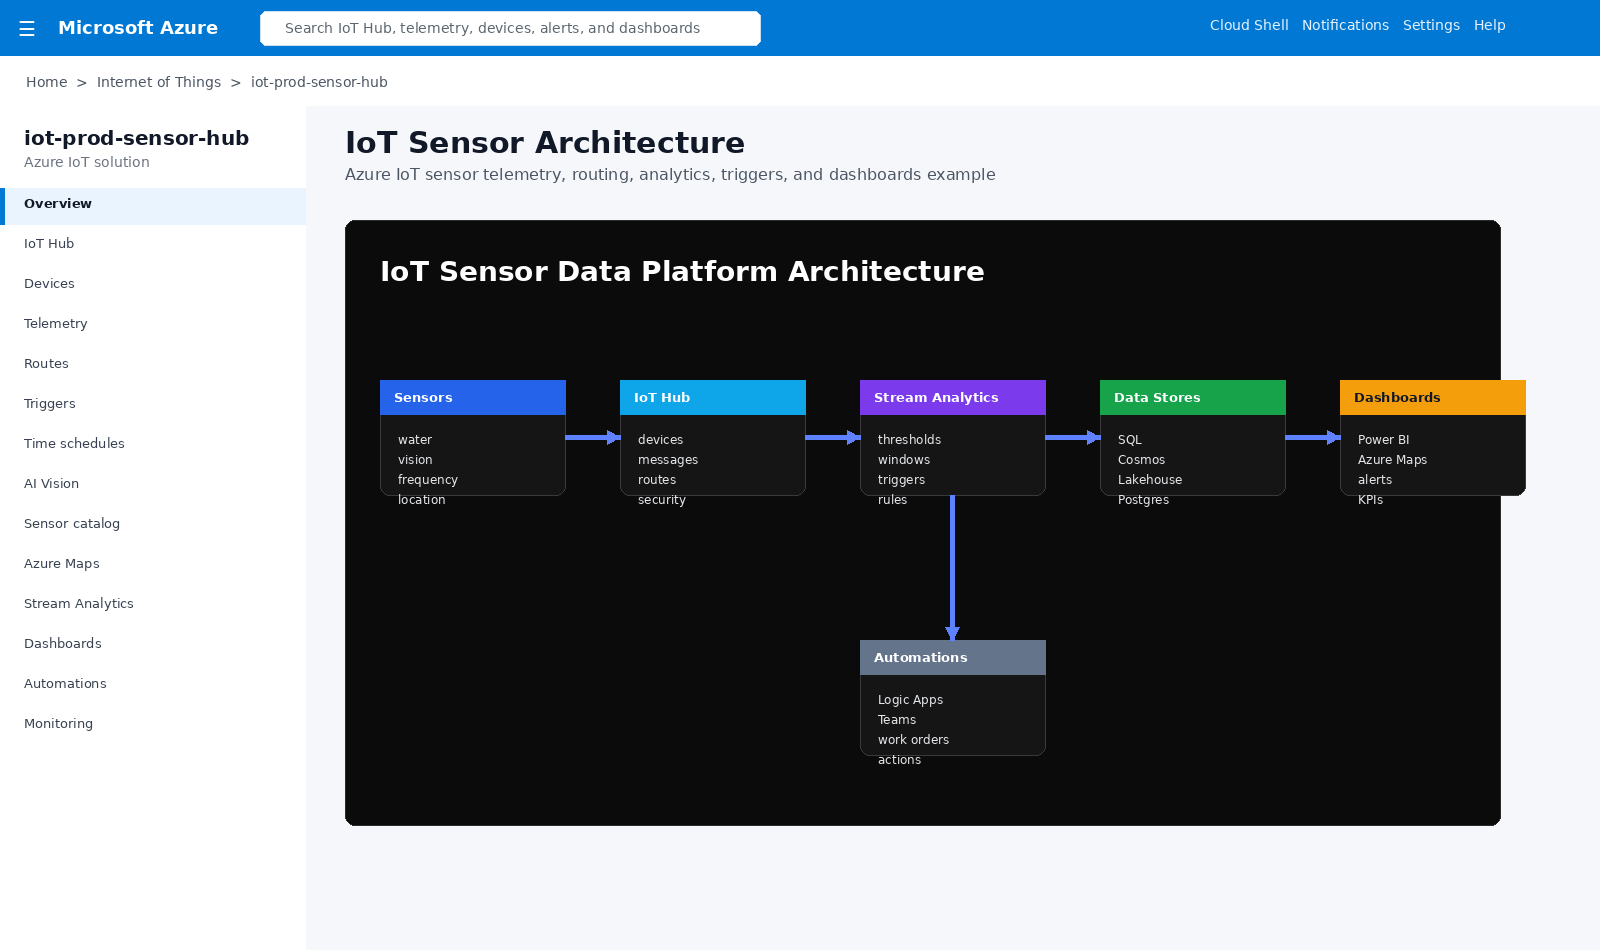
IoT sensor platform architecture

IoT Platform Architecture

Sensors, IoT Hub, Stream Analytics, data stores, dashboards, automations, and actions work together.

Architecture Flow

Sensors

Water, vision, spectrum, frequency, bandwidth, height, action, environmental, and location sensors.

IoT Hub

Device registration, telemetry ingestion, device messages, routes, and security.

Analytics

Stream Analytics, rules, thresholds, schedules, anomaly checks, and AI vision events.

Data

Azure SQL, Cosmos DB, lakehouse, PostgreSQL, time-series data, and history.

Action

Dashboards, Azure Maps, Logic Apps, Teams alerts, work orders, and approvals.

This pattern turns physical sensor readings into operational intelligence. Devices collect telemetry, Azure ingests and routes the data, thresholds and schedules trigger action, and dashboards show what is happening across assets, locations, and time.

Business Value

  • Real-time visibility into physical environments, assets, facilities, and field operations.
  • Custom-fit sensor options that match operational and facade requirements.
  • Automated threshold response instead of manual monitoring.
  • Integrated dashboards with historical trends, geospatial awareness, and alert history.
  • Better operational decisions using telemetry, AI vision, schedules, and analytics.

Example Production Flow

  • Select and design sensors for the physical environment.
  • Install sensors and register devices in Azure IoT Hub.
  • Stream telemetry into Azure services and store history.
  • Apply thresholds based on time, schedule, measurement, location, size, shape, color, or AI vision output.
  • Trigger alerts, dashboards, work orders, approvals, and automated actions.
Back to Capabilities